See what you keep from each sale after the item, ads, shipping, payment fees and returns, and what your ads have to return to break even.
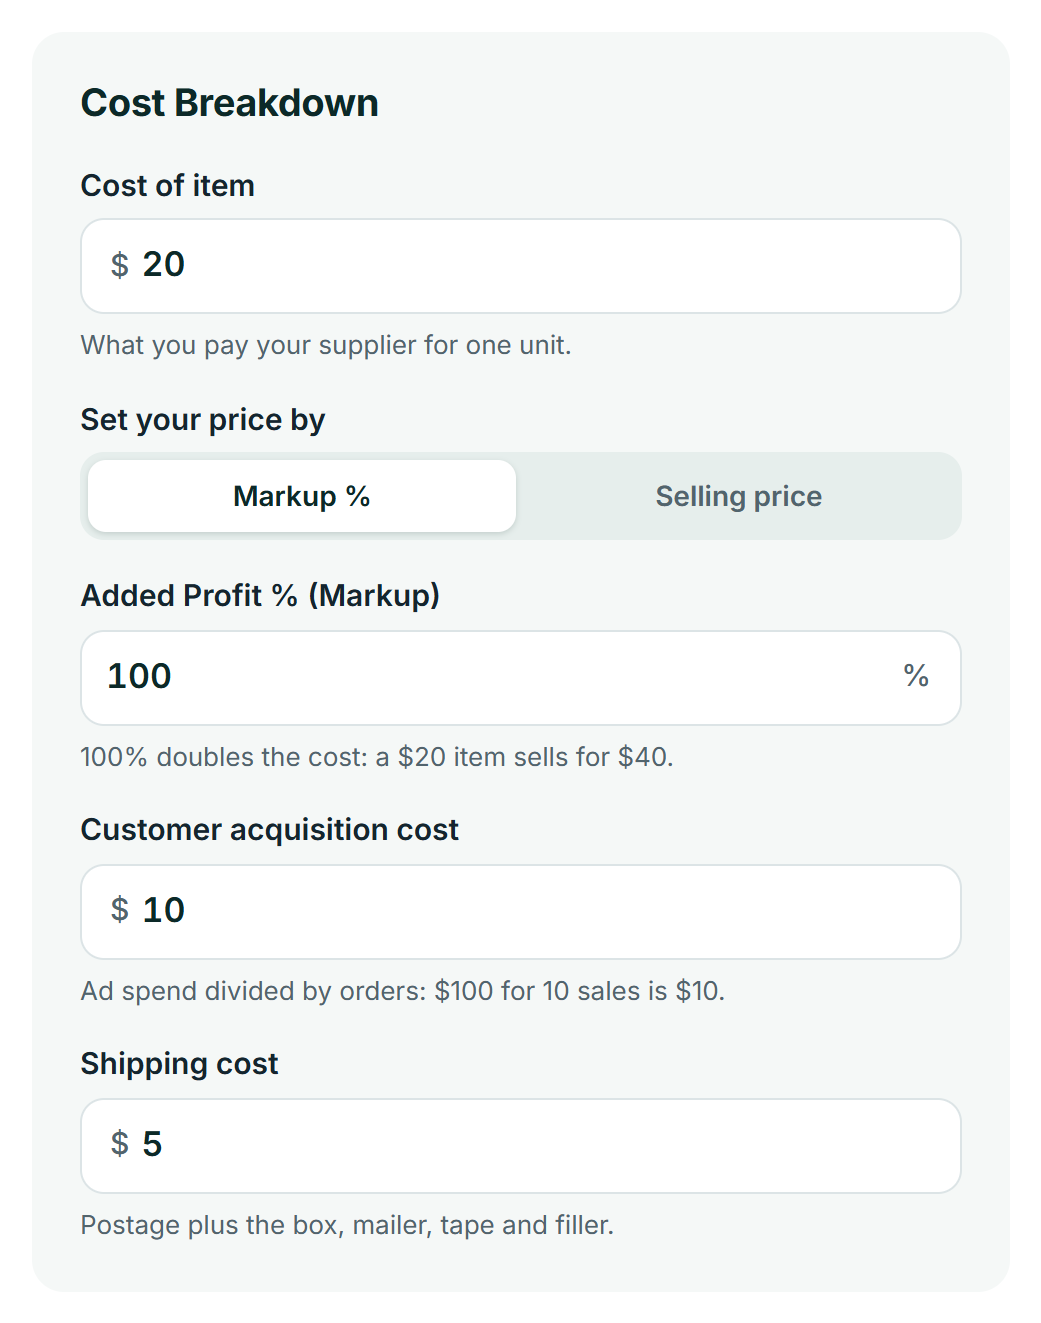
Cost Breakdown
$
What you pay your supplier for one unit.
%
100% doubles the cost: a $20 item sells for $40.
$
What the customer pays for one unit.
$
Ad spend divided by orders: $100 for 10 sales is $10.
$
Postage plus the box, mailer, tape and filler.
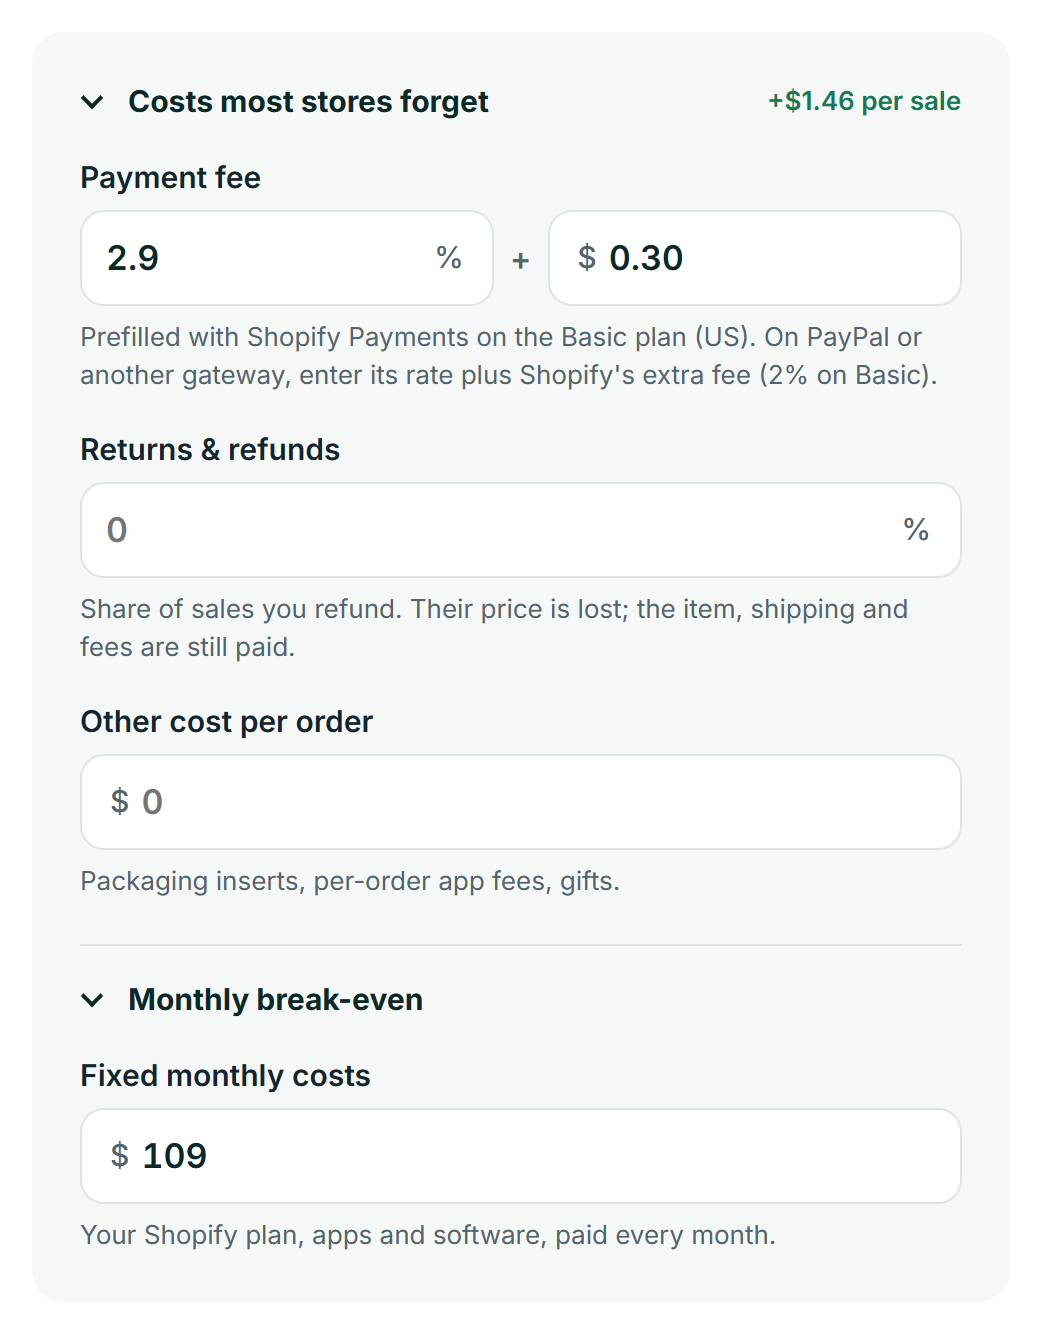
Costs most stores forget
Payment fee
%
+
$
Prefilled with Shopify Payments on the Basic plan (US). On PayPal or another gateway, enter its rate plus Shopify's extra fee (2% on Basic).
%
Share of sales you refund. Their price is lost; the item, shipping and fees are still paid.
$
Packaging inserts, per-order app fees, gifts.
Monthly break-even
$
Your Shopify plan, apps and software, paid every month.
Profit Overview
Net Profit / Sale
$0.00
Enter your costs to see your margin
Selling Price
$0.00
Gross Margin
0%
OpEx Impact
0%
Net Margin
0%
Break-even ROAS
–What your ads must return
Max CAC
–Most you can pay per customer
Cost Distribution
Total cost: $0.00
Product0%
Ads0%
Shipping0%
Fees & other0%
Net profit0%
Fill in the cost of your item and your price to get a plan for your margin.
Just a heads-up: As a Shopify Media Partner, I may earn a small commission if you sign up. It won’t cost you anything, and it helps me continue providing free resources.
The Ultimate Shopify Profit Margin Calculator & Growth Guide
Launching a Shopify store is exciting, but true success comes from knowing your numbers. Beyond beautiful product photos and a clever brand name, your profit margin is the single most critical metric for survival and growth. It dictates your pricing strategy, marketing budget, and ultimately, your store’s long-term health.
To get started, you need a clear picture of your profitability. Our free Shopify profit margin calculator is the first step. It’s designed to help you calculate your net profit per sale after product cost, ads, shipping, payment fees and returns, visualize your cost distribution, and see the return your ads need to break even, turning complex calculations into a clear action plan.
Use our calculator to find your profit margin, then see how easy it is to manage your finances with a free trial of Shopify.
How to Use Shopify Profit Margin Calculator: A Step-by-Step Guide
Our calculator is more than just a tool; it’s a diagnostic for your business. By understanding each input and output, you can move from simply calculating your profit to actively improving it. Here’s how to get the most out of it.
Part 1: Enter Your Costs in the “Cost Breakdown” Section
This first section is where you input all the variable costs associated with a single sale. Accuracy here is key to getting a true picture of your profitability.
Cost of item: This is your Cost of Goods Sold (COGS). Enter the amount you pay your supplier for one unit of the product. If you manufacture the product yourself, include all raw material costs.
Added Profit % (Markup) or Selling price: Choose how you want to set your price. With Markup %, a 100% markup doubles the item’s cost, so a $20 item sells for $40, and the calculator works out your Selling Price for you. If you already know your price, switch to Selling price and enter it directly.
Customer acquisition cost (CAC): This is your average marketing spend to acquire one customer. To find it, divide your total ad spend by the number of sales from that campaign. For example, if you spend $100 on ads to get 10 sales, your CAC is $10 per sale.
Shipping cost: Include the total cost to ship the item to your customer. Don’t forget to factor in the price of boxes, mailers, tape, and any other packaging materials.
Below these, the Costs most stores forget section covers the small per-order costs that quietly eat into your margin:
Payment fee: What your payment provider takes from every order. It’s prefilled with 2.9% + $0.30, the Shopify Payments rate on the Basic plan in the US. If you use PayPal or another gateway, enter that gateway’s rate plus Shopify’s extra transaction fee (2% on the Basic plan).
Returns & refunds: The share of your sales you end up refunding. On a refunded order you lose the sale, but you’ve still paid for the item, the shipping and the fees.
Other cost per order: Anything else you pay on every order, such as packaging inserts, per-order app fees or a free gift.
Want to know how many orders you need each month? Open Monthly break-even and enter your Fixed monthly costs. I explain how that works further down.
Part 2: Understand Your “Profit Overview”
Once you’ve entered your costs, the calculator instantly generates your “Profit Overview.” This section tells the financial story of each sale.
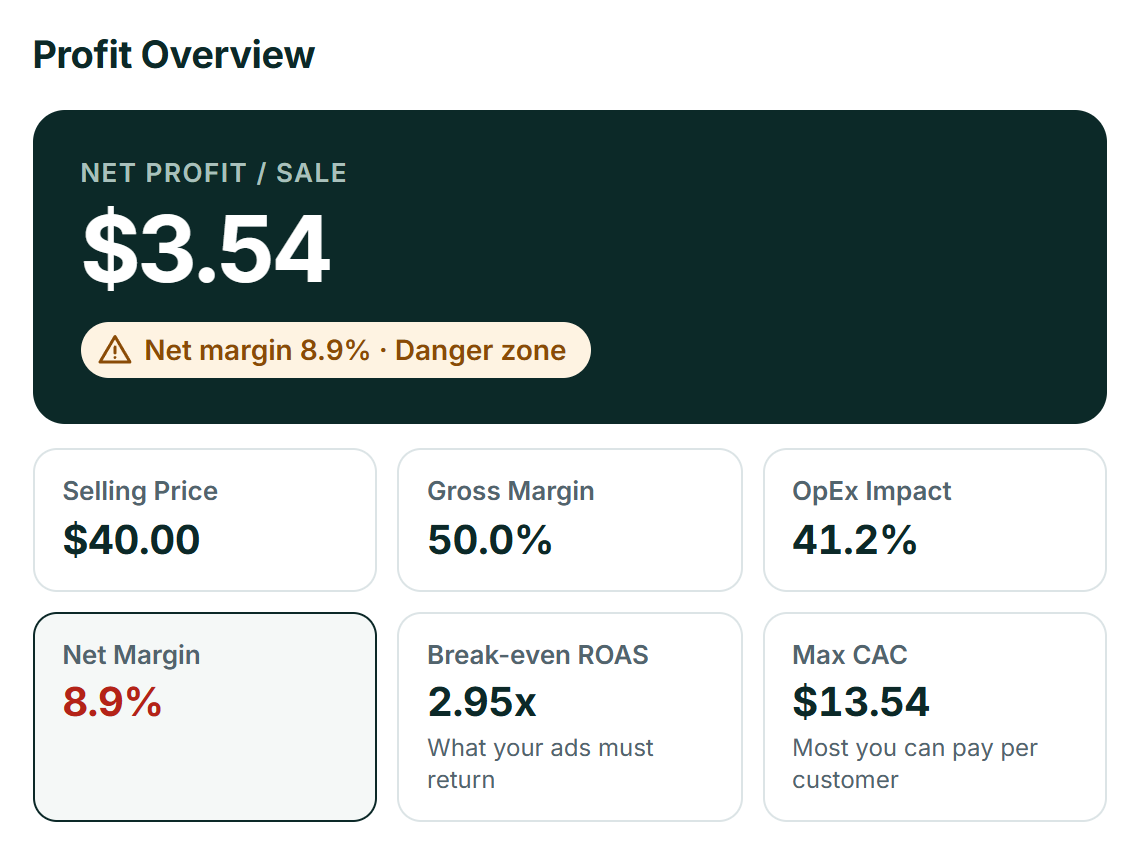
Selling Price & Gross Margin: First, the tool shows your final Selling Price, calculated from your markup or taken straight from the price you entered. It then shows your Gross Margin—the profit you make before subtracting operational expenses like advertising and shipping. This is your profit on the product itself.
OpEx Impact: This metric is your competitive edge. “OpEx Impact” shows you exactly what percentage of the selling price is consumed by your operational expenses: ads (CAC), shipping, payment fees, refunds and any other per-order costs. A high number here is a red flag that these costs are eating away at your potential profit.
Net Profit / Sale & Net Margin: To me, these are your most important numbers. Net Profit / Sale is the actual cash you earn from a single transaction. Net Margin shows that profit as a percentage of the selling price, and the line under your profit tells you which zone you’re in: Danger, Healthy or Power (I explain each one below). This is the ultimate metric to track for your store’s financial health.
Break-even ROAS: The return your ads must bring in just to cover the cost of each sale. A Break-even ROAS of 3x means every $1 you spend on ads has to bring in $3 in sales before you make a cent of profit. If your ads return less than that, they’re losing you money.
Max CAC: The most you can spend on ads to win one sale and still break even. Compare it with your actual CAC: the gap between the two is your profit on each order.
Part 3: Visualize Where Your Money Goes with “Cost Distribution”
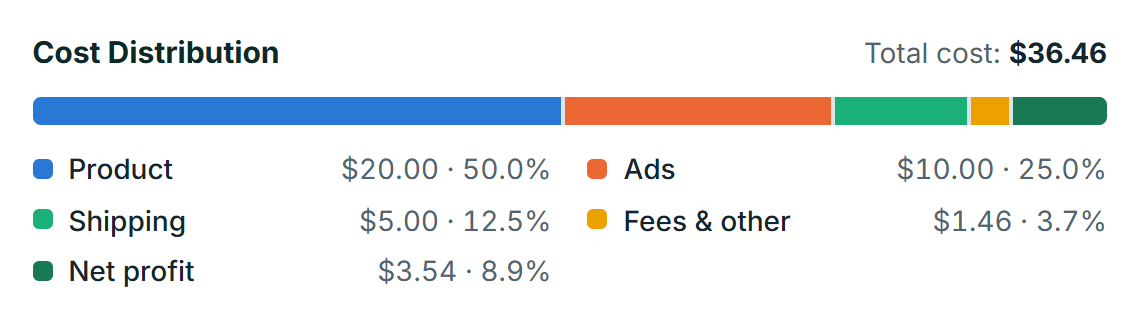
Finally, the “Cost Distribution” bar gives you an instant visual breakdown of your revenue. It splits your selling price into product, ads, shipping, fees and other costs, and what’s left as net profit, so you can see the biggest drains on your income at a glance. The legend underneath shows the dollar amount and percentage of each part.
Is your product cost too high compared to everything else? Are your shipping costs, ad spend or payment fees taking up too much of the final sale price? This visualization helps you spot problems and opportunities immediately, so you know exactly where to focus your optimization efforts.
Part 4: Turn Your Numbers into an Action Plan
Below the chart, the calculator gives you a short plan based on your results:
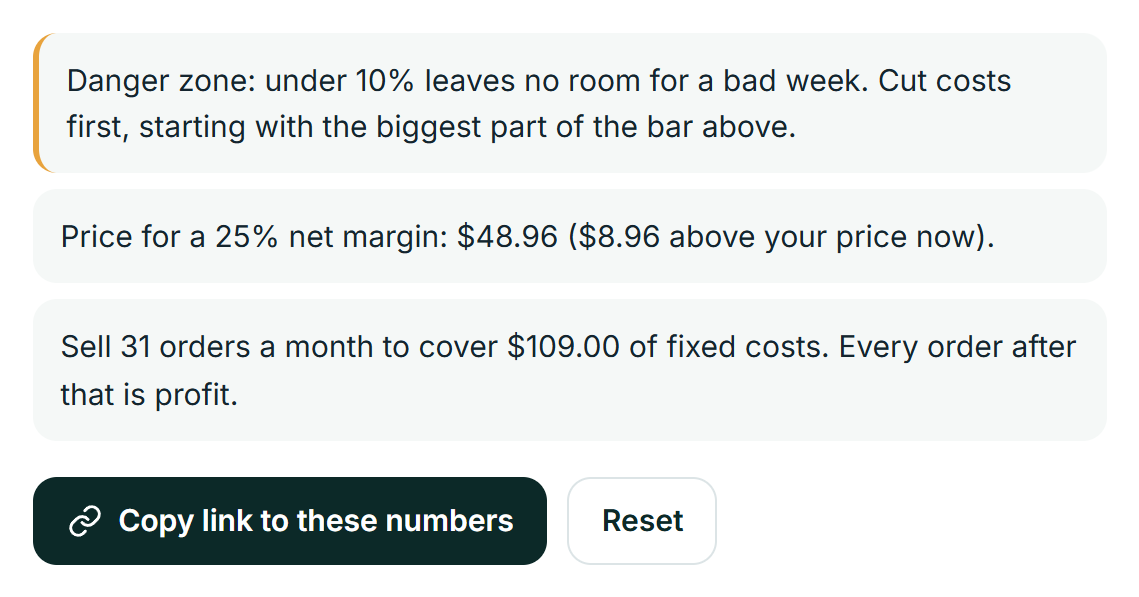
What to do next: a tip for your current margin zone, from cutting costs to protecting your profits.
Price for a 25% net margin: the selling price you’d need to reach a 25% net margin after every cost you entered, and how far that is from your price now.
Monthly break-even: if you entered your fixed monthly costs, how many orders a month you need to cover them.
Here’s a quick example. Say your item costs $20, you use a 100% markup, your CAC is $10 and shipping is $5. With the standard 2.9% + $0.30 payment fee, you keep $3.54 per sale, a net margin of 8.9%. The calculator puts you in the Danger Zone, tells you your ads need a 2.95x ROAS just to break even, and shows that a price of $48.96 would get you to a 25% net margin. Add the $109 of fixed monthly costs from the example in the next section, and you’d need to sell 31 orders a month just to break even.
Want to save your numbers or share them with a business partner? Click Copy link to these numbers. The link opens the calculator with all your figures already filled in.
Beyond One Sale: How to Calculate Your Monthly Break-Even Point
Knowing your profit on a single sale is the first step. The next is understanding how that number scales across your entire business. This is where you connect per-product profitability to your overall monthly goals and determine your break-even point—the moment your store starts making real money.
To put those profit targets into context, it also helps to understand how much the average store makes per month so you can benchmark your revenue expectations against real-world store performance.
Using Your “Net Profit / Sale” for Business Planning
The Net Profit / Sale figure from the calculator is the key to understanding your business’s viability. Think of it as the contribution each sale makes toward paying for your fixed monthly operating costs—the expenses you have to pay whether you make one sale or one hundred. Once those fixed costs are covered, this amount becomes your actual take-home profit.
The Break-Even Formula: How Many Sales Do You Need?
To find out how many sales you need to make each month just to cover your costs, you can use a simple break-even formula. This calculation tells you the minimum number of units you must sell to avoid losing money.
Monthly Break-Even Point (in units) = Total Monthly Fixed Costs / Net Profit per Sale
A Practical Example: From a Single Sale to Monthly Profit
Let’s put this formula into action with a clear, step-by-step example.
First, imagine our calculator shows your Net Profit / Sale is $63.00.
Next, list your total fixed monthly costs. These are the recurring platform and software fees you pay each month. For a detailed analysis of what to expect, our complete budget breakdown covers the real Shopify website cost.
Don’t forget common expenses beyond just your Shopify plan:
Shopify Plan: $39/month
App Subscriptions: $50/month (e.g., for email marketing, reviews, or loyalty apps)
Other Software: $20/month (e.g., accounting or design tools)
This means you need to sell at least 2 units per month just to cover your fixed costs. Every sale after the second one is pure profit, directly contributing to your business’s growth.
You don’t have to do this math by hand. Open Monthly break-even in the calculator, enter your fixed costs, and it does the division for you, rounded up to whole orders. With the numbers above, it tells you to sell 2 orders a month to cover $109.00 of fixed costs.
What Your Net Margin Means (And Your Action Plan)
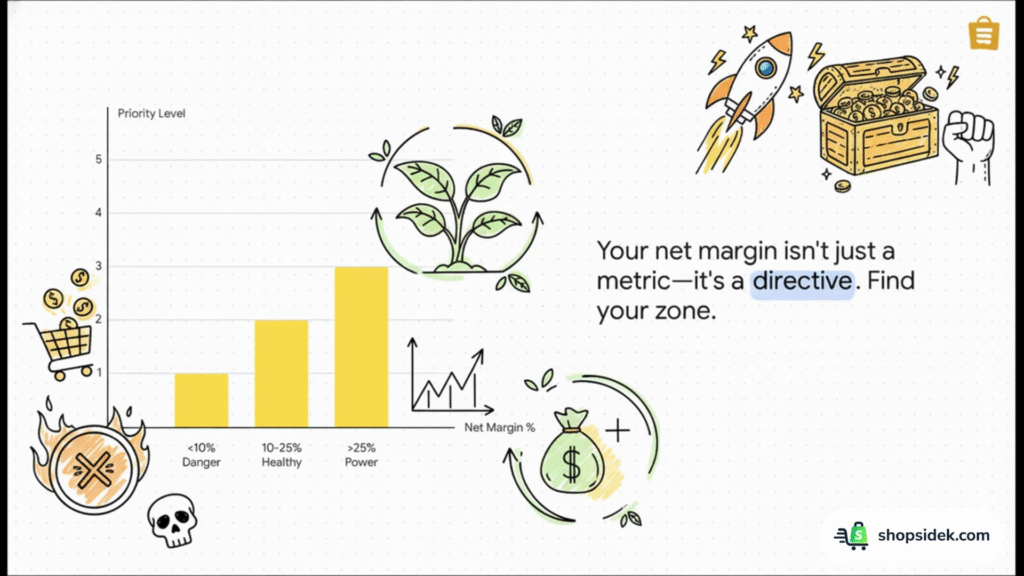
The number from our Shopify profit margin calculator isn’t just a metric—it’s a directive. Your net margin tells you what to do next. Find your range below and start following your tailored action plan.
Below 10% (The Danger Zone): Your Immediate Fix-It Plan
A net margin under 10% is a critical alert. While it might be acceptable for very high-volume businesses, for most Shopify stores it’s unsustainable and leaves no room for error or reinvestment. Your immediate priority is to reduce your costs.
Start by looking at your “OpEx Impact” in the calculator and at the longest parts of the Cost Distribution bar. If OpEx Impact is high, focus on optimizing your ad spend, finding more efficient shipping solutions and checking your refund rate. Next, revisit your Cost of item; contact your suppliers to negotiate better rates or explore sourcing alternatives. A small reduction in your core costs can have a massive impact on your margin.
10% – 25% (The Healthy Zone): How to Optimize for Growth
Congratulations—you’ve built a solid financial foundation. A net margin in this range means your business is healthy and ready to scale profitably. I recommend your focus should shift from cutting costs to strategic growth.
Here are three steps to take:
Increase Average Order Value (AOV): Use post-purchase upsells or create product bundles to encourage customers to spend more in a single transaction.
Improve Conversion Rates: Make small, data-driven tweaks to your product pages and checkout process to turn more visitors into buyers.
Optimize Ad Spend: Go beyond basic CAC and start tracking your Break-even ROAS (Return On Ad Spend). This metric tells you the exact return you need from your ads to stay profitable, and our calculator shows it right next to your margin. Keep every campaign above that number.
Above 25% (The Power Zone): How to Protect and Scale Your Profits
A net margin over 25% is exceptional. You have a highly profitable product and a solid business model. Your goal now is to build a defensible brand that can protect your high margins and fuel long-term growth.
Focus on these three areas:
Invest in Customer Retention: Use tools like Yotpo to build powerful loyalty and rewards programs. It’s far cheaper to retain a happy customer than to acquire a new one.
Diversify Marketing Channels: Reduce your reliance on paid ads by exploring content marketing, SEO, or influencer partnerships to build more sustainable traffic sources.
Build a Strong Brand: Your high margin gives you the resources to invest in branding, customer service, and a premium experience that justifies your pricing and insulates you from lower-cost competitors.
Expert Advice: Avoid These 3 Common Shopify Profitability Mistakes
In my experience helping hundreds of merchants navigate their finances, I’ve seen a few costly mistakes pop up time and again.
To confirm my observations and provide an even deeper insight, I reached out to Daniel Carter, an ecommerce CPA who has helped over 100 Shopify stores scale profitably. I asked him about the most common errors he sees.
His top warning? “The biggest mistake I see is merchants ignoring the ‘reverse’ costs,” Carter says. “Forgetting to factor in the cost of processing returns and replacing damaged goods can silently erase your profits. A 20% margin can become 5% without you even realizing it.”
You can see this effect in our calculator: enter the share of sales you refund under Returns & refunds and watch your net margin drop.
Beyond returns, Carter highlights three critical mistakes that new store owners make:
Ignoring the full cost of shipping. The postage price is just the beginning. True shipping costs include boxes, mailers, tape, labels, and protective filler. These small items add up, and failing to account for them in your pricing can erode your margin on every single order.
Underestimating app subscription creep. That brilliant reviews app for $15/month? The helpful upsell app for $20/month? Individually, they seem insignificant. But together, these subscriptions can create hundreds of dollars in fixed monthly costs, dramatically raising your break-even point. Add them up, enter the total under Fixed monthly costs in our calculator, and you’ll see how many orders it takes each month just to pay for them.
Pricing based on markup instead of a target net margin. Many sellers simply double their product cost (a 100% markup) and call it a day. Profitable stores work backward. They decide on a target net profit margin (e.g., 20%) and use that to calculate the final selling price after all variable costs—including ads and shipping—are accounted for. This profit-first approach ensures your pricing strategy is built for growth from day one. Our calculator does this for you: below your results, it shows the price you need for a 25% net margin after all the costs you entered.
What’s a Good Net Margin? (2026 Benchmarks for Shopify Sellers)
One of the most common questions new store owners ask is, “Is my profit margin any good?” Personally, I think the answer always depends on your industry.
A tech retailer selling high-volume, low-margin products will have a very different financial profile than a boutique selling high-margin, low-volume handmade goods.
While your specific numbers will vary, you can use industry benchmarks as a helpful guide to set realistic goals. The table below shows the typical gross margin ranges for popular ecommerce sectors. This is your profit before deducting costs like marketing and shipping.
Industry
Average Gross Margin Range
Digital Products
70% – 90%
Beauty and Cosmetics
50% – 60%+
Fashion and Apparel
30% – 50%
Home Goods
25% – 45%
Electronics
10% – 20%
So, where does that leave your net margin?
After you subtract your operational costs—like advertising, shipping, app fees, and transaction fees—your net margin will be lower. To run these numbers for your own store and see how different transaction rates affect your final take-home pay, you can use our Shopify pricing calculator to compare monthly plans.
According to experts in the Shopify community, a healthy net profit margin for most ecommerce stores is between 10% and 20%. If your gross margin is within your industry’s average range but your net margin is below 10%, it’s a clear sign that your operational expenses are too high and need to be optimized.
Start Building Your Profitable Business on Shopify Today
Understanding your profit margin is not a one-time task—it’s the foundation of your ongoing growth strategy. Every pricing decision you make, every marketing campaign you launch, and every cost you cut should be guided by this critical number. A clear view of your profitability is what separates struggling stores from successful ones.
Now that you know your numbers, it’s time to put them to work. The Shopify free trial is the perfect risk-free environment to test your pricing and build your store. To make the most of that crucial starting period, you can follow our 90-day plan to launch a profitable store from day one.
Shopify provides all the integrated tools you need to control your costs, optimize your pricing, and scale your business with confidence.
Note: I’m a Shopify Media Partner, which means I might earn a small commission if you sign up through my link. It doesn’t cost you anything extra and helps keep this blog running.
This is a critical distinction that often confuses new entrepreneurs. While both relate to profit, they measure it from different perspectives.
Markup is your profit relative to the cost of the item. It’s used to set your selling price. For example, if a product costs you $50 and you apply a 100% markup, you add $50 to the cost, resulting in a $100 selling price.
Margin, on the other hand, is your profit relative to the selling price. In the same example, your $50 profit from a $100 selling price represents a 50% profit margin. Understanding this difference is key to accurately pricing your products and analyzing your store’s health.
Our calculator is designed to help you analyze the profitability of a single product, which is perfect for planning and pricing. To find your store’s overall average profit margin, you’ll need to use your Shopify Analytics reports.
Set a specific date range (e.g., the last 30 days) and use the following formula:
(Total Revenue – Total COGS – Total Variable Expenses) / Total Revenue
This will give you a comprehensive view of your entire business’s financial performance, accounting for your full mix of products and all associated costs over that period.
Our free calculator is essential for strategic planning, setting prices, and analyzing the potential of new products. However, once your store is operational and handling daily orders, you may want to automate your financial tracking.
This is when a paid app like TrueProfit or Bloom Analytics becomes valuable. These tools sync directly with your Shopify store and ad platforms (like Facebook Ads) to provide a live, real-time profitability dashboard. They save you hours of manual calculation and help you make faster, data-driven decisions as you scale.
If negotiating with suppliers isn’t an option, focus on the other side of the equation: increasing revenue from each customer and conversion.
The most effective strategy is to increase your Average Order Value (AOV). You can achieve this through:
Product bundling: Sell related items together for a slight discount.
Post-purchase upsells: Offer a complementary product after a customer completes their checkout.
Free shipping thresholds: Encourage customers to add more to their cart to qualify for free shipping.
Additionally, focus on Conversion Rate Optimization (CRO). By improving your product pages and checkout experience, you can get more sales from your existing ad spend, which effectively lowers your Customer Acquisition Cost (CAC) and boosts your net margin on every sale.
It’s important to understand that our Shopify profit margin calculator shows you the pre-tax profit per sale, often referred to as operating profit. This is the profit your business operations generate before accounting for taxes.
When you use the calculator, enter your selling price without sales tax or VAT, since that money goes to the government, not to you.
Your final, take-home net profit is what remains after all business taxes have been deducted. Tax obligations can vary significantly based on your location, business structure (e.g., sole proprietorship vs. LLC), and total income. Because of this complexity, we strongly recommend consulting with a professional accountant to ensure you are planning accurately for your tax liabilities.
We use cookies to ensure that we give you the best experience on our website. If you continue to use this site we will assume that you are happy with it.